Special Core Analysis
- MICP and pore size distribution (Pore Morphology Model)
- Steady and unsteady-state relative permeability (LBM)
- Initial water saturation and residual oil saturation
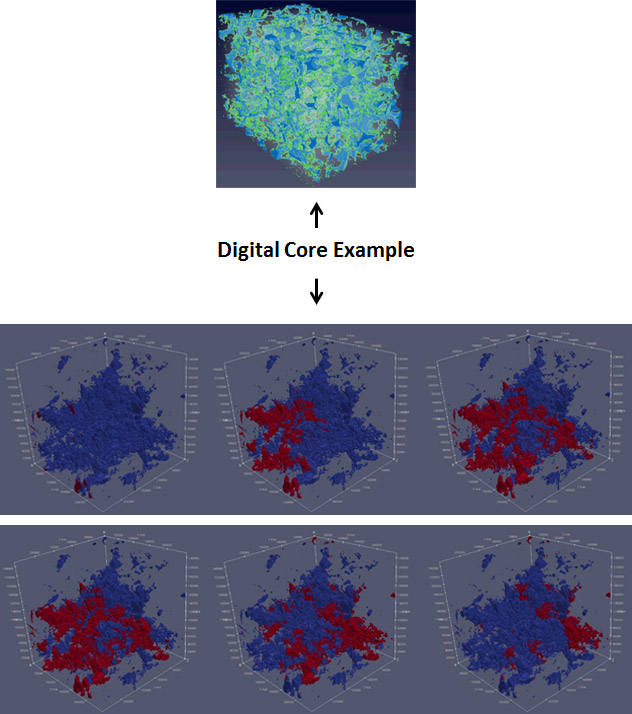
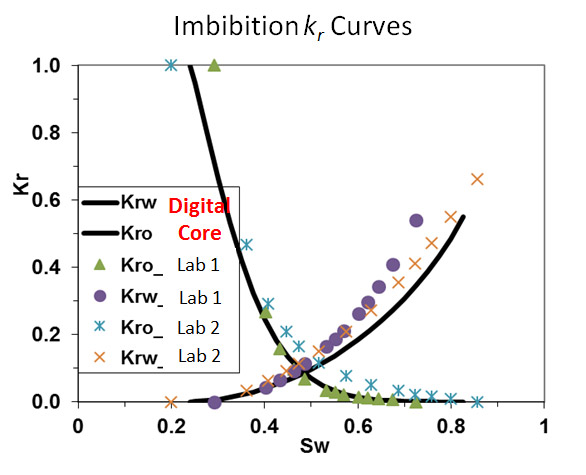
Comparison Between Digital Core and Lab Results
Two USS kr laboratory measurements were conducted. Digital core evaluation of kr is within 15% error.
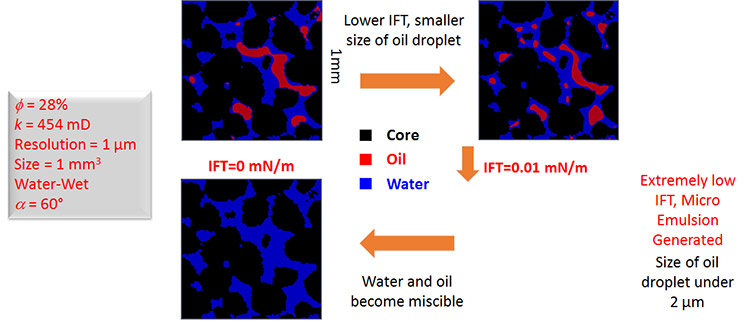
Effect of IFT Reduction
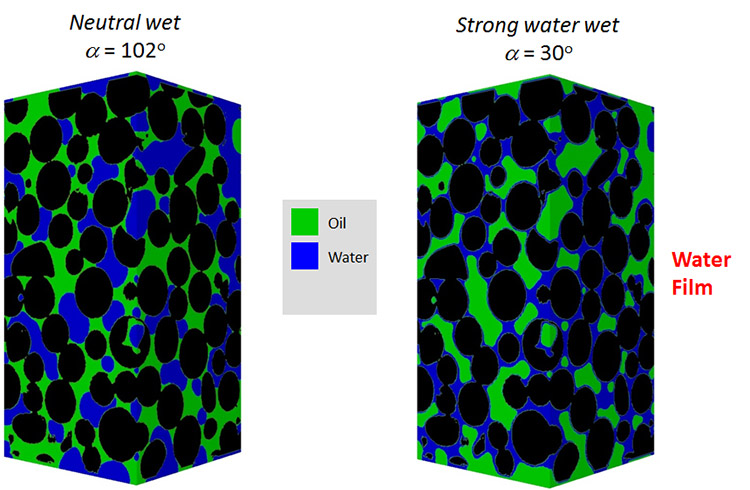
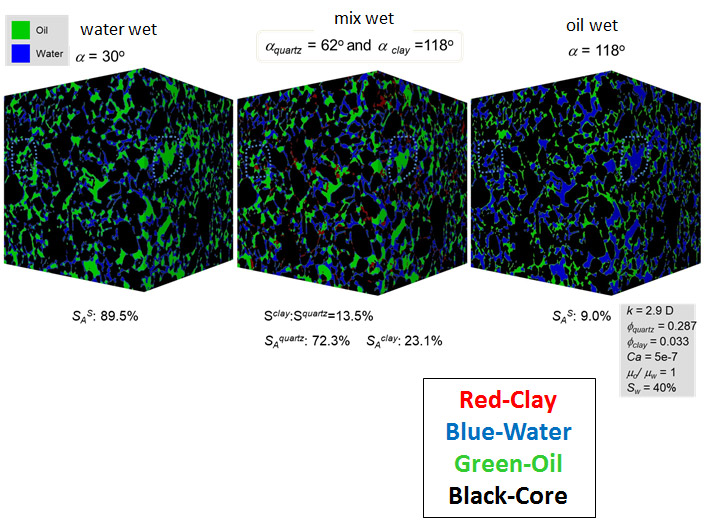
Effect of Wettability on Phase Distribution
Digital Core can visualize and quantify the percentage of water/oil coverage on the rock, as well as the residual oil occurrence
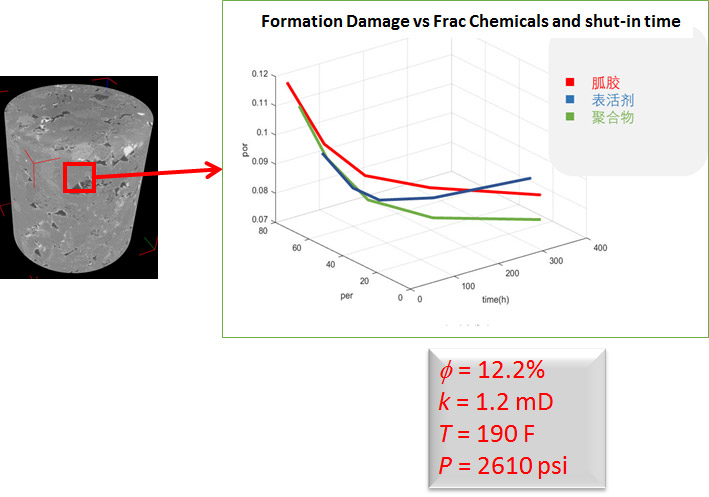
Formation Damage Evaluation
Porosity/permeability curve, pore throat distribution etc. can be calculated before and after immersing in various frac fluids and shut-in time:
Before immersing:
- Average pore radius: 1.65 µm
- Average pore throat: 1.05 µm
After immersing:
- Average pore radius: 1.38 µm
- Average pore throat: 0.78 µm
Identification of Clay Minerals
- Pores, rock, and clay mineral can be identified through micro-CT and XRF
- Wettability can be assigned to different minerals: quartz as water-wet, and clay as oil-wet
- Sensitivity study can be analyzed via various contact angle
Coreflood + Real-Time Micro-CT
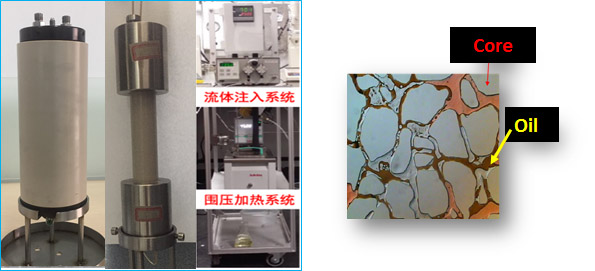
- T < 250 F,P < 3500 psi
- Micro-plug diameter can be 0.4 and 1 inch
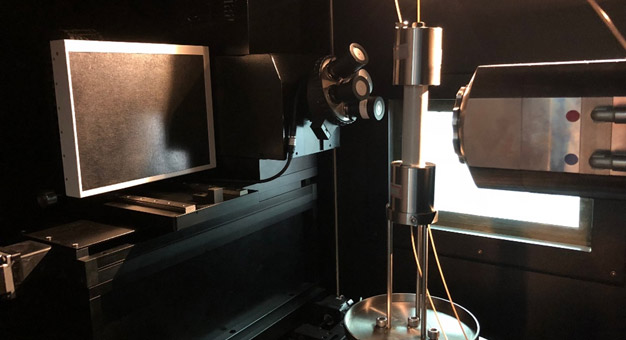
Special Core Analysis
Waterflood or EOR (ASP, polymer, CO2, etc.) can be conducted w/ micro-CT scanning at different PV to observe the oil/water distribution